4 The Amorphous Kitaev Model
Methods
This section describes the novel methods we developed to simulate the AK model including lattice generation, bond colouring and the inverse mapping between flux sector and gauge sector. All results and figures herein were generated with Koala [1].
Voronisation
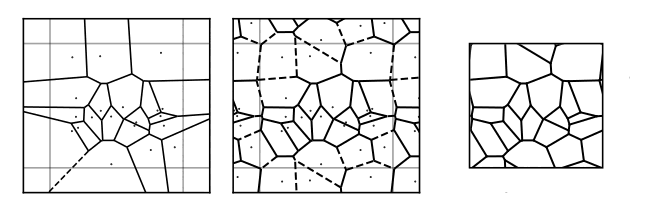
The lattices we use are Voronoi partitions of the torus [2–4]. We start by sampling seed points uniformly on the torus. As most off the shelf routines for computing Voronoi partitions are defined on the plane rather than the torus, we tile our seed points into a \(3\times3\) or \(5\times5\) grid] 1 before calling a standard Voronoi routine [5] from the Python package Scipy [6]. Finally, we convert the lattice defined by the central cell into a toroidal lattice. We do this by reassigning edges that cross the boundaries to connect to the corresponding point within the lattice, yielding a trivalent lattice on the torus. We encode our lattices with edge lists \([(i,j), (k,l)\ldots]\). The information about which edges crossed the boundaries is stored in an additional 2D vector \(\vec{v} \in \{-1,0,+1\}^2\) for each edge that encodes the sense in which it crosses the periodic boundary conditions. This is equivalent to how the edge would leave the unit cell were the system to tile the plane, see appendix A.4 for more detail. The graph generated by a Voronoi partition of a 2D surface is always planar. This means that no edges cross each other when the graph is embedded into the plane. It is also trivalent in that every vertex is connected to exactly three edges [7,8].
Colouring the Bonds

To be solvable, the AK model requires that each edge in the lattice be assigned a label \(x\), \(y\) or \(z\), such that each vertex has exactly one edge of each type connected to it, a three-edge-colouring. This problem must be distinguished from that considered by the famous four-colour theorem [9]. The four-colour theorem is concerned with assigning colours to the vertices of planar graphs, such that no vertices that share an edge have the same colour.
For a graph of maximum degree \(\Delta\), \(\Delta + 1\) colours are always enough to edge-colour it. An \(\mathcal{O}(mn)\) algorithm exists to do this for a graph with \(m\) edges and \(n\) vertices [10]. Graphs with \(\Delta = 3\) are known as cubic graphs. Cubic graphs can be four-edge-coloured in linear time [11]. However, we need a three-edge-colouring of our cubic graphs, which turns out to be more difficult. Cubic, planar, bridgeless graphs can be three-edge-coloured if and only if they can be four-face-coloured [12]. Bridges are edges that connect otherwise disconnected components. An \(\mathcal{O}(n^2)\) algorithm exists for these [13]. However, it is not clear whether this extends to cubic, toroidal bridgeless graphs.
A four-face-colouring is equivalent to a four-vertex-colouring of the dual graph, see appendix A.4. So if we could find a four-vertex-colouring of the dual graph we would be done. However, vertex-colouring a toroidal graph may require up to seven colours [14]! The complete graph of seven vertices \(K_7\) is a good example of a toroidal graph that requires seven colours.
Luckily, some problems are easier in practice. Three-edge-colouring cubic toroidal graphs is one of those things. To find colourings, we use a Boolean Satisfiability Solver or SAT solver. A SAT problem is a set of statements about a set of boolean variables \([x_1, x_2\ldots]\), such as “\(x_1\) or not \(x_3\) is true”. A solution to a SAT problem is an assignment \(x_i \in {0,1}\) that satisfies all the statements [15]. General purpose, high performance programs for solving SAT problems have been an area of active research for decades [16]. Such programs are useful because, by the Cook-Levin theorem [17,18], any NP problem can be encoded (in polynomial time) as an instance of a SAT problem. This property is what makes SAT one of the subset of NP problems called NP-Complete. It is a relatively standard technique in the computer science community to solve NP problems by first transforming them to SAT instances and then using an off-the-shelf SAT solver. The output of this can then be mapped back to the original problem domain.
Whether graph colouring problems are in NP or P seems to depend delicately on the class of graphs considered, the maximum degree and the number of colours used. It is therefore possible that a polynomial time algorithm may exist for our problem. However, using a SAT solver turns out to be fast enough in practice that it is by no means the rate limiting step for generating and solving instances of the AK model. In appendix A.4 I detail the specifics of how I mapped edge-colouring problems to SAT instances and show a breakdown of where the computational effort is spent, the majority being on matrix diagonalisation.
Mapping between flux sectors and bond sectors

In the AK model, going from the bond sector to flux sector is done simply from the definition of the fluxes
\[ \phi_i = \prod_{(j,k) \; \in \; \partial \phi_i} i u_{jk}.\]
The reverse, constructing a bond sector \(\{u_{jk}\}\) that corresponds to a particular flux sector \(\{\Phi_i\}\) is not so trivial. The algorithm I used, shown visually in fig. 3 is this:
Fix the gauge by choosing some arbitrary \(u_{jk}\) configuration. In practice, we use \(u_{jk} = +1\). This chooses an arbitrary one of the four topological sectors.
Compute the current flux configuration and how it differs from the target. Consider any plaquette that differs from the target as a defect.
Find any adjacent pairs of defects and flip the \(u_{jk}\) between them. This leaves a set of isolated defects.
Pair the defects up using a greedy algorithm and compute paths along the dual lattice between each pair of plaquettes using the A* pathfinding algorithm [19]. Flipping the corresponding set of bonds transports one flux to the other and annihilates both.
Next Section: Results
Bibliography
To see why we sometimes need to tile to \(5\times 5\), consider the left panel of fig. 1. At the boundaries some of the edges emanate out to infinity. In the middle panel we see that tiling to \(3\times 3\) removes the infinite edges emanating from the central cell. This is necessary in order to transform this to a toroidal graph since we do not allow a vertex to be located at the point at infinity. For very small lattices, there can sometimes still be infinite edges emanating from the central cell. This is generally fixed by going to a \(5\times 5\) tiling.↩︎